Tech
Lauri Andler
Jan 24, 2019
The perfect storm: The story of the city launch that brought Wolt down
This is a post about the engineering behind Wolt, where we share what it takes to deliver millions of meals a year.
With 14 cities launched at the time of the incident in question (a bit over a year ago), we were just getting used to launching new cities here at Wolt. That is why no-one expected major technical issues when launching yet another city.
This is the story of launching a Finnish city called Jyväskylä on the 26th of October 2017 – something that was supposed to be routine Thursday for the engineering team that turned into a technical rogue wave that brought Wolt down for a while and launched an in-depth exploration into the internals of our service to make sure it won’t happen again. The root cause behind it turns out to be such an unbelievably rare set of circumstances that we decided to publish what happened.
The initial event
At Thursday, 2017-10-16 13:52 UTC we received the first signs of trouble: Our automatic alerting system alerted us of rising queue lengths in one of our main work queues. This was followed shortly after by an alert at 13:53 of abnormally high database loads. Within the next 3min we got automatic notifications of all of our services using our main mongodb replica set being unresponsive to even basic pings. It was immediately clear to us we were down hard.
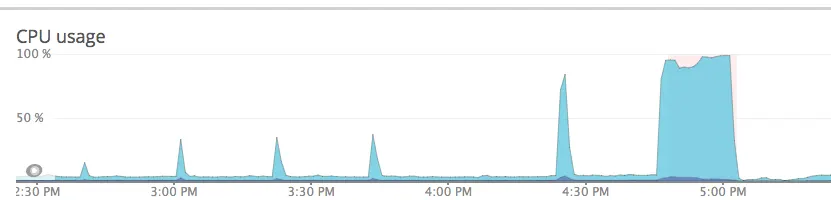
When looking at the CPU usage of our mongodb primary instance, it was evident there had been some previously unnoticed CPU usage spikes before the major event:
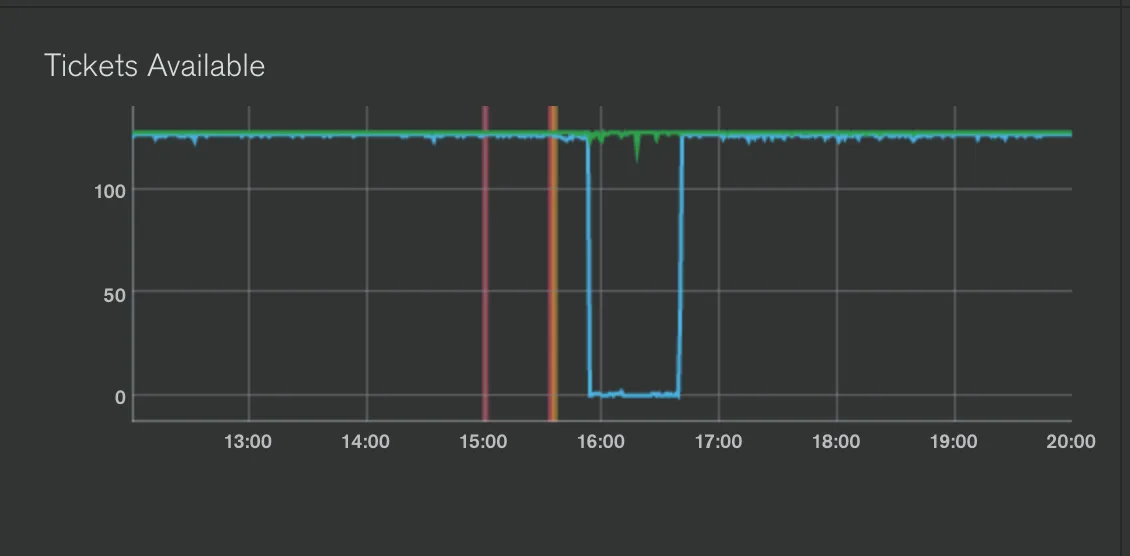
We also noticed that we had exhausted the amount of read tickets on the database:
We responded by failing over the primary instance to a secondary instance in our replica set. This was successful in bringing the replica set back up, but our problems had only just begun.
Secondary issues
Failing health checks
Even though the replica set was back up and responding, and we noticed some throughput returning, we still weren’t fully back up – response times did not recover, and based on feedback from the rest of the company various services were unresponsive.
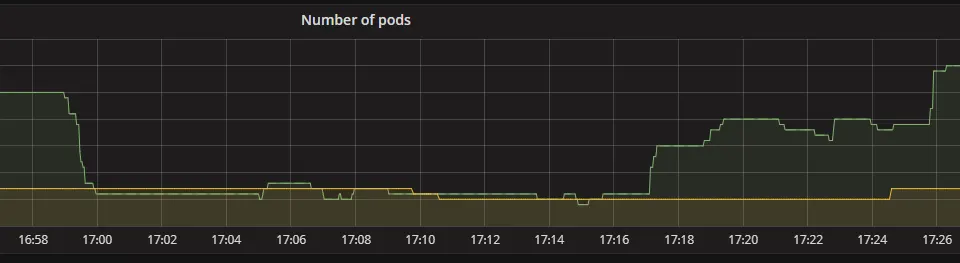
The first issue we found was that our API servers we had very recently moved to be hosted on Kubernetes had scaled down to a very low number of pods during the primary event. Now that throughputs were picking up again, it couldn’t spawn more pods due to all new existing pods getting so much traffic they didn’t pass the health check. We manually increased the amount of pods to a high enough amount to remedy this. By 14:20 UTC we were running an acceptable amount of pods again.
DDOSing ourselves
One thing that wasn’t immediately obvious, but we realized after the main events were over was that during all of this we were effectively DDOSing ourselves with our clients’ retry logic. For example, here is a graph of how often our restaurant iPads called a certain configuration endpoint during the issue:
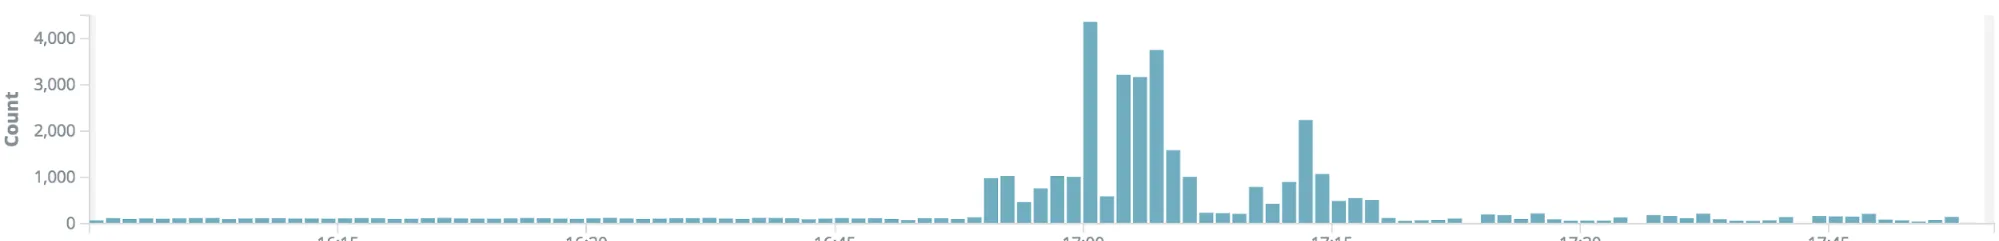
This particular call turned out to be very problematic – it was making a query to a collection with 45k documents that didn’t hit any index, resulting in a COLLSCAN. Normally this hasn’t been problematic due to the low amount of documents in the collection and the low throughput, but obviously it made the initial situation worse once our clients started hammering these endpoints.
A similar pattern could be seen on other endpoints / clients as well. We had previously encountered a similar issue and corrected most of the retry logic to be less aggressive, but this made it clear that we had missed a few spots.
Cold caches
We also encountered issues with our secondaries that were elected as new primaries not having a warmed up cache, thus being slow to respond when they became secondaries. While this did not cause the service to be down, it did cause us to hesitate before opening up deliveries again. We are investigating ways of pre-heating the secondaries before electing them as primaries.
Finding the root cause of the primary event
After we were back up, we started investigating the causes behind the failure. Already during the event, we were checking the slow query logs of mongodb. A few particularly common queries popped up: First, the previously mentioned query that caused a COLLSCAN due to a missing index. We created the necessary index to fix that. It was quite clearly not the root cause since it was only going through 45k documents – bad, but manageable.
The second query we saw popping up constantly immediately as the initial event started was a query that had the name of the problem staring us in the face: “Jyväskylä”. It was a query related to some time estimation code that fetches a few fields from the last 200 purchases in a city. Seems simple enough, should always run in under the 100ms slow query limit, right? Well, it turned out the query had taken over 30min in the worst cases. What’s more, it seemed like it was iterating over our whole purchase collection, which at the time held a seven-digit amount of purchases.
Because this was a query executed with every app open, it was getting executed a lot and it exhausted the amount of read tickets very fast. We normally cache the response of the query, but none of the queries had returned by the time we were out of tickets and the database was running at unacceptable loads.
As soon as we discovered this, we deployed a fix at 17:39 UTC that removed the potentially problematic query from the code. We didn’t know it at the time, but this fixed the root cause 3h 47min after the first signs of trouble. We started digging deeper into why the query could potentially fail as catastrophically as it did, and to reproduce the failure to make certain we had fixed it.
Replicating and understanding the failure
Even though we were seeing Jyväskylä-related slow queries in the database, we didn’t initially believe the city launch could be an issue – after all, we had launched tens of cities before this with exactly the same query. Why would something fail for Jyväskylä, when it hadn’t failed for, for example, Riga 4 days earlier?
We started doubting that the particular 200 purchase query could be an issue even more, once we started testing on our secondary production databases – the query completed blazingly fast.
However, after a lot of testing and looking at the logs from during the event, we noticed one difference: the database was using a different index now. At the time of the primary event, it was using an index on the field time_received, which denotes when the purchase was received on the server. Now it was using an index on the field city, which stores the plain-text name of the city. We started suspecting the worst: it had started scanning the whole collection in an effort to find 200 purchases from Jyväskylä. It seems obvious it should use the index on city field since it was launch day and there are under 200 purchases that would match that index.
We were able to replicate the issue of super-long query times locally by querying with the time_received index by forcing its use with .hint().
So, at this point this much was clear:
This “Get the last 200 purchases in Jyväskylä” query was the culprit. The queries took multiple minutes to complete, thus exhausting the amount of read tickets available for other queries almost instantly
It was searching for these purchases in a descending chronological order, until it found 200 purchases. Unfortunately 200 purchases were not available, so it went through the whole collection.
The issue started immediately when mongodb changed query plans – this was quite nicely visible in our logs. As soon as it switched to the time-based index the issue started.
So, the question now boiled down to:
Why did mongodb’s query planner suddenly start using this clearly suboptimal index for the query?
Understanding mongo’s query optimizer
Mongo’s basic query planning is explained here: https://docs.mongodb.com/manual/core/query-plans/ . The basic idea is simple: generate candidate plans, evaluate them, pick the best performing plan and use that to complete the query (and for subsequent queries through plan caching).
Clearly, in this case the planner chose badly. Instead of choosing a plan that would immediately narrow the amount of purchases searched down to a manageable amount, it picked an index that had the potential of scanning the whole collection.
So why did it choose this plan out of the plans evaluated? Why had this never been an issue before, even though the query had been in the codebase for a year? A stack overflow answer lead us towards the first hint at the solution. Mongo does not (perhaps obviously) iterate over the whole result set before rejecting the worst-performing plans – it only gets the first 101 documents from the cursor before running the query to its completion with the winning plan.
It turns out the issue started almost immediately after we went over 101 purchases on launch day. However, it didn’t still make full sense to us – why would it select a plan that has to search through all Wolt cities’ recent purchases, instead of being able to focus on only the small amount of purchases in Jyväskylä? Clearly searching through 102 purchases should still be faster than through all purchases in the last 12 hours?
However, then we realized something: We have a lot more purchases than a few hundred in Jyväskylä. Actually, we had thousands of purchases in Jyväskylä at that time. This was due to the fact that we had a now-discontinued technical integration with Kotipizza, which has pizzerias in Jyväskylä. So actually, when using the city index it had to look through (and sort by time) over a thousand purchases to find the recent-most 101. These Kotipizza purchases did not satisfy the full query conditions, but they had to be searched through anyways when using the city index. It turns out this was close to the amount of purchases it had to go through with the time-based index to find the 101 first purchases, with the exception that sorting was cheaper due to the nature of the index.
So, it chose the index that caused the failure because that index performed marginally better than the correct index when searching for the first 101 purchases, but failed miserably when trying to find the final 99 purchases requested.
So in other words, all of the following had to be true for this failure to manifest:
We had to launch a city with thousands of pre-existing, non-Wolt delivered orders
The amount of purchases in that city within a short amount of time had to be between 101 and 200
The total amount of non-Kotipizza purchases in the city had to be under 200
There had to be a large number of users looking at the app at the same time (usually not true before 200 purchases are completed since before we had launched cities at a slower pace than Jyväskylä)
Mongo had to re-evaluate the query plan during the short period of time when these conditions were true and choose the catastrophic plan out of the two plans that both performed almost exactly equally for the first 101 results.
Fixing the specific issue & preventing similar issues
Now that the issue was obvious, fixing it at its root was easy. In fact, there were multiple options: we could either set a hard limit for the time the query looks back (which makes sense in any case considering the query’s application), or hit a better suited index by slightly changing the fields we query. We chose to implement both to be sure.
While it is of course important to fix the specific issue, we think it’s really important to fix the “systemic” issue in some way as well. In other words, figuring out fixes that would have prevented similar failures (Since it will never realistically be possible to find all possibly problematic queries):
Adding a default timeout to all of our mongo queries with maxTimeMS
Better visibility of our slow query logs in the tech team
More rate limiting and fixes to our client side retry logic
We had also already started other improvements independently of this issue that would have helped in other more minor issues during this type of a failure, like some services getting out-of-sync on the states of certain things. This incident was further validation that we are on the right track with many of the choices we have made recently.
In conclusion
In the end this incident taught us a lot of things – but most importantly it made one thing clear: no matter how long something has been working “just fine” with the same code, it can fail suddenly without any warning due to anomalous events like launches.